Profit/Loss graphs lose scale when bars overlap start of period
Reported by frog | December 5th, 2012 @ 04:56 AM
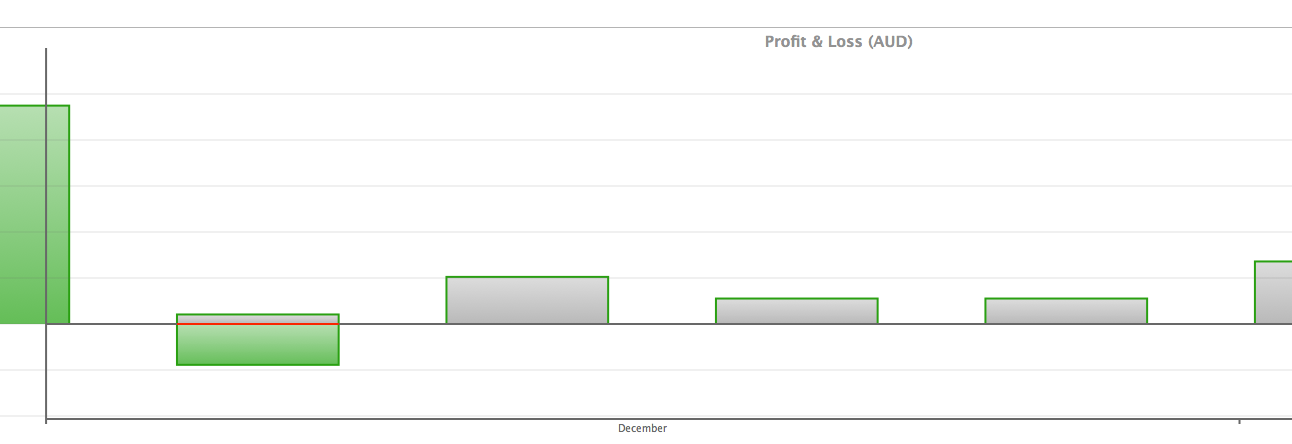
The bar graphs in the profit/loss graph divide the period into discrete sub-periods, e.g. in a "Monthly" view, the bars are per week. If the first bar does not align well with the start of the period, then the scale is not shown on the vertical axis.
For example, see December 2012 (1st December is a Saturday),
where the first week/bar ends overlaps the axis, so the scale is
lost.
Compare this to October 2012 (1st October is a Monday), where the
first week/bar starts after the axis, and so the scale is
visible
From a quick sample of months in 2012, the only time you see the scale is when the month starts on a Monday.
See attached screenshot for an example. The screenshot is of the graph from a monthly view of December 2012, and extends all the way to the edge of the window.
 screen-shot-2012-12-05-at-251.png
Comments and changes to this ticket
-

Virgil Dupras December 8th, 2012 @ 09:51 PM
- State changed from “new” to “accepted”
- Tag set to “bug, chart”
You're right, thanks for pointing it out. It must be a result of my recent chart drawing upgrades with the automatic X-axis adjustments that take place when weekly bars overflow. I seldom use date range smaller than a year, that's probably why I missed it.
-
Virgil Dupras December 15th, 2012 @ 10:33 PM
- Assigned user set to “Virgil Dupras”
-
Virgil Dupras December 15th, 2012 @ 10:35 PM
- State changed from “accepted” to “fixed”
(from [13518b6a6adc]) [#352 state:fixed] Fixed glitch in bar graph's xaxis drawing. https://bitbucket.org/hsoft/moneyguru/changeset/13518b6a6adc/
Please Sign in or create a free account to add a new ticket.
With your very own profile, you can contribute to projects, track your activity, watch tickets, receive and update tickets through your email and much more.
Create your profile
Help contribute to this project by taking a few moments to create your personal profile. Create your profile »
People watching this ticket
 frog
frog
 Virgil Dupras
Attachments
-
 screen-shot-2012-12-05-at-2...
29.8 KB
screen-shot-2012-12-05-at-2...
29.8 KB